
In the previous lesson, you learned that hypothesis testing follows a structured template, a sequence of steps designed to help you evaluate claims and make decisions using data rather than intuition. While it’s important to understand that structure, the structure doesn’t answer real business questions by itself. To do that, you need to see how each step plays out in practice, using actual data and concrete decisions.
This lesson focuses on performing a hypothesis test from start to finish. Rather than introducing new statistical theory, it demonstrates how to apply the existing framework to a realistic business scenario. The emphasis is on execution, interpretation, and decision-making: how to move from a question to a conclusion in a disciplined and defensible way.
By the end of this lesson, you should be able to take a business problem, translate it into a hypothesis test, carry out the necessary steps, and interpret the results in terms that are meaningful for decision-makers.
Business Scenario and Research Question
To illustrate the process, consider the same scenario introduced in the previous lesson. Suppose you’re a business owner evaluating whether to adopt a new marketing strategy. Implementing the strategy involves time, cost, and risk, so you want evidence that it leads to higher sales before committing to it fully.
This situation naturally leads to a clear research question: Does the new marketing strategy increase sales compared to the current strategy? The question is specific and measurable. It’s also directly tied to a business decision. Furthermore, it lends itself well to hypothesis testing because it involves comparing outcomes under two conditions: before and after the strategy change.
Translating the Question into Hypotheses
With the research question defined, the next step is to express it formally using statistical hypotheses. As discussed in the previous lesson, this involves stating a null hypothesis and an alternative hypothesis that represent competing claims about the population:
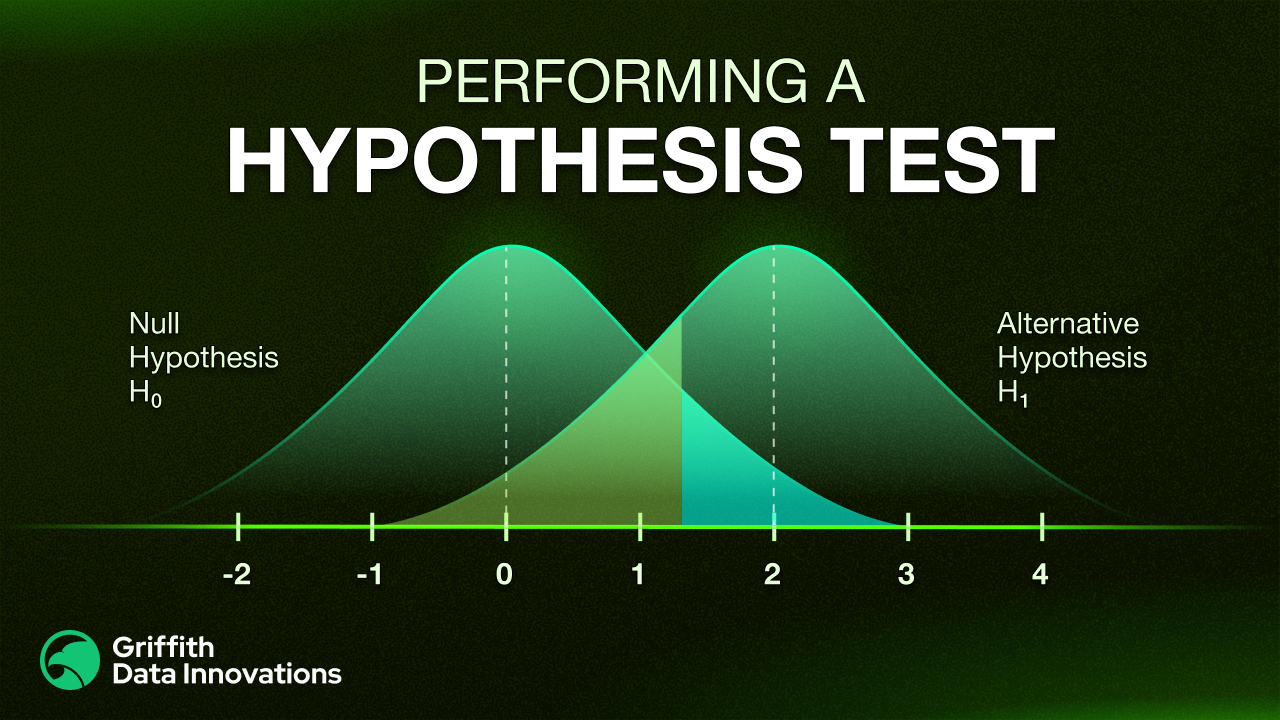
- In this example, the null hypothesis (H₀) states that the new marketing strategy does not increase sales. In practical terms, this means that average sales before and after implementing the strategy are the same.
- The alternative hypothesis (H₁), on the other hand, reflects the possibility that the business owner is interested in testing: that the new marketing strategy leads to higher average sales after implementation.
Because the question is framed specifically around an increase in sales rather than any change at all, this is a directional hypothesis. That choice matters, as it affects how you’ll be conducting and interpreting the statistical test later. The hypotheses now provide a precise, testable formulation of the original business question and serve as the foundation for the remaining steps in the hypothesis testing process.
Preparing and Exploring the Data
Before you perform any statistical test, you’ll need to examine the data that you’ll be using in the analysis. In this scenario, suppose you collect weekly sales figures in thousands of dollars from eight stores for one week before and one week after implementing the new marketing strategy.
For example, the data might look like this:
| Store | Sales Before | Sales After |
| Store A | 52 | 55 |
| Store B | 47 | 49 |
| Store C | 61 | 63 |
| Store D | 58 | 60 |
| Store E | 50 | 54 |
| Store F | 46 | 47 |
| Store G | 63 | 66 |
| Store H | 55 | 56 |
Because each store has a “before” and “after” value, the data are naturally paired. A useful first step is to look at the differences between the two periods. In this example, most stores show a modest increase in sales, with differences ranging from about 1 to 4 thousand dollars.
At this stage, the goal is not to draw conclusions, but to ensure the data are suitable for analysis. You would still check for missing values and confirm that sales have been measured consistently. This is also where you’d compute basic descriptive statistics such as the mean and standard deviation of the differences. Visual inspection, such as a simple plot of the differences, can also help identify outliers or unusual patterns that may affect later steps.
Selecting the Appropriate Statistical Test
Once you’ve adequately understood and prepared your data, the next step is to determine which statistical test is appropriate for answering the research question. This decision depends on the structure of the data and the type of variables involved, as well as the way the observations are related to one another.
In this example, sales figures are continuous numerical data, and the comparison is between two related measurements taken from the same stores. Because each “before” value is directly linked to an “after” value, the observations are paired rather than independent.
For these reasons, a paired t-test is an appropriate choice. Rather than comparing the two sets of sales figures directly, the paired t-test focuses on the differences between them. It evaluates whether the average of those differences is significantly different from zero, which aligns precisely with the question of whether the new marketing strategy leads to higher sales.
Checking Test Assumptions
As we discussed previously, every statistical test relies on certain assumptions, and it’s important to verify that your intended test reasonably verifies these assumptions before proceeding. The key assumption for this paired t-test is that the differences in sales between the two periods are approximately normally distributed.
Using the differences from the example data, you might examine a histogram or a Q–Q plot to see whether the distribution appears roughly symmetric and free of extreme outliers. You don’t have to expect perfect normality when working with a small sample, but you also don’t want to encounter severe skewness or unusual values. The absence of these is usually a good sign that the test results will be reliable.
Checking assumptions at this stage helps you confirm that the chosen test is appropriate for the data at hand. If you find that the assumptions were clearly violated, you’d likely need to consider an alternative testing approach.
Performing the Hypothesis Test
With the test selected and assumptions verified, you can now perform the hypothesis test. This typically involves using statistical software to calculate a test statistic based on the set of sales differences.
Suppose this analysis produces a test statistic of 2.6 and a corresponding p-value of 0.03. The test statistic reflects how large the observed average increase in sales is relative to the variability in the data, under the assumption that the true average difference is zero.
The p-value indicates how likely it would be to observe an average increase of this size or larger if the null hypothesis were true. In other words, it quantifies the strength of the evidence the data provides against the assumption that the marketing strategy has no effect.
Making a Statistical Decision
After you perform the hypothesis test, the next step is to decide whether the evidence is strong enough to reject the null hypothesis. This decision is based on comparing the p-value produced by the test to a predefined significance level, denoted by α.
Remember, the significance level represents the amount of uncertainty you’re willing to accept when drawing conclusions from data. For example, setting α to 0.05 means you can tolerate a 5% risk of rejecting the null hypothesis even if it is actually true. You choose this threshold before analyzing the data, so it serves as a consistent standard for evaluating results.
In this example, the paired t-test produces a p-value of 0.03. This value indicates that, if the null hypothesis were true and the marketing strategy had no real effect on sales, there would be a 3% chance of observing an increase in sales as large as the one seen in the data, purely due to random variation.
Because 0.03 is smaller than the chosen significance level of 0.05, the observed result is considered unlikely under the null hypothesis. As a result, you can reject the null hypothesis and deem the result statistically significant. This conclusion reflects the strength of the evidence provided by the data, not a guarantee of future outcomes.
Rejecting the null hypothesis means that the observed increase in sales is unlikely to be explainable by chance alone, given the assumptions of the test. It doesn’t imply that sales will definitely increase under the new strategy, and it also doesn’t measure the practical importance of the change in strategy itself. It does, however, provide statistical support for the claim that the new strategy has increased sales.
Interpreting and Communicating the Results
Once you make a decision, you’ll need to translate the results into clear and meaningful conclusions for stakeholders. This involves stating the outcome of the test and explaining what it implies about the original business question. It’s also a good time to acknowledge any limitations your test might have.
In this example, a statistically significant result would suggest that the new marketing strategy is associated with higher sales and provide evidence to support its adoption. A non-significant result, on the other hand, would indicate that the available data don’t demonstrate a clear improvement; in this case, it makes more sense to exercise caution before making changes.
Effective communication emphasizes clarity and transparency. Rather than focusing solely on statistical terminology, it’s best to frame results in terms of what the data do and don’t support. Ultimately, hypothesis testing informs decisions by reducing uncertainty, not by eliminating it entirely.
Bringing the Process Together
You don’t necessarily perform a hypothesis test to find certainty. It’s more about applying a disciplined process to evaluate evidence and guide decisions. When you follow each step carefully, you gain a clearer understanding of what the data can legitimately support.
With practice, this structured approach becomes a practical tool for assessing strategies and reducing risk. It’s one of the best ways to make more confident business decisions overall. You can apply the same process across a wide range of questions, as long as you respect the underlying assumptions and context.

