
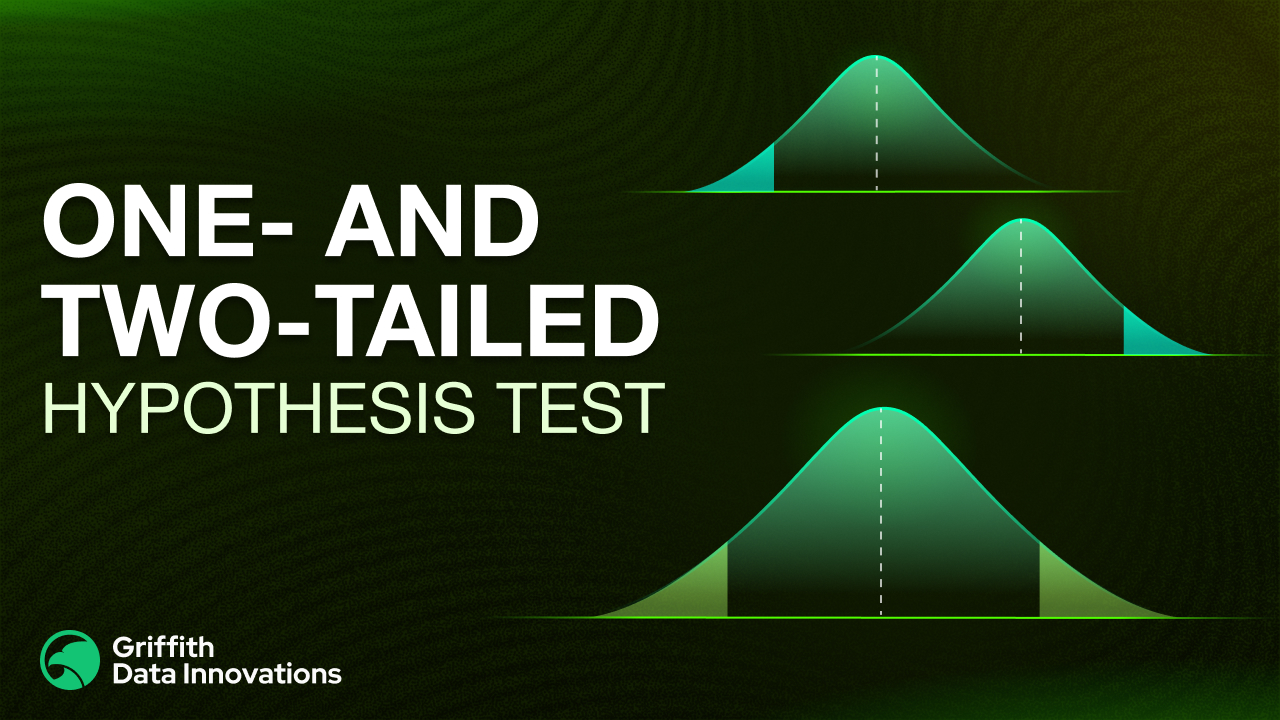
As you progress through business statistics, it becomes clear that hypothesis testing is not just a mechanical process of plugging numbers into formulas. It starts much earlier, with how you frame the question you want the data to answer. After learning the basic concepts of hypothesis testing and the steps involved in performing a test, the next idea to understand is how the direction of a hypothesis affects the analysis itself.
This involves determining whether you require a one-tailed or two-tailed hypothesis test. Choosing between them determines how rejection regions are formed, how p-values are interpreted, and how confident you can be in the conclusions you draw for your business.
Why Direction Matters in Hypothesis Testing
Every hypothesis test begins with a question. Sometimes that question asks whether performance has improved. Other times, it asks whether something has changed at all. While this difference may seem subtle, it has important implications for how statistical evidence is evaluated.
In hypothesis testing, you define a null hypothesis (H0), which represents the status quo, and an alternative hypothesis (H1 or H𝑎), which represents what you are testing for. The alternative hypothesis can be directional or non-directional, and this distinction determines whether a one-tailed or two-tailed test is used.
From a business perspective, this matters because statistical tests are tied to decisions. The way you define “evidence” should match the action you plan to take once results are available.
What Is a One-Tailed Hypothesis Test?
A one-tailed hypothesis test is used when you are interested in detecting an effect in only one direction. The alternative hypothesis specifies whether the parameter of interest is greater than or less than a certain value.
Mathematically, a one-tailed test uses symbols such as:
- H1 : μ > μ0
- H1 : μ < μ0
Here, μ represents the population mean, and μ0 represents the value stated in the null hypothesis.
Because the alternative hypothesis is directional, the rejection region lies entirely in one tail of the sampling distribution. The level of significance (α), which is often set at 0.05 in the business context, is concentrated in that single tail.
Example of One-tailed Test Use
Suppose you want to know whether a new sales training program increases average monthly revenue per salesperson.
- H0 : μ ≤ μ0
- H0 : μ > μ0
Your interest lies only in improvement. If the new program does not increase revenue, it does not meet your objective. In this case, a one-tailed test aligns naturally with the business question.
If the calculated test statistic falls into the rejection region, or if the p-value is less than α, you reject the null hypothesis and conclude that the program likely increased revenue.
When a One-Tailed Test Is Appropriate
A one-tailed test is appropriate when the direction of interest is clearly defined before data is collected. This often occurs when a business decision depends on exceeding a benchmark or achieving a minimum improvement.
Examples include testing whether:
- A new process reduces defects below a target rate
- A system improves response time
- A marketing campaign increases conversion rates
In these cases, outcomes in the opposite direction may be irrelevant to the decision. However, it is important to note that choosing a one-tailed test increases sensitivity in one direction while completely ignoring the other. For this reason, the justification must come from the business context, not from the data.
What Is a Two-Tailed Hypothesis Test?
A two-tailed hypothesis test is used when you want to detect any difference from the null hypothesis, regardless of direction. The alternative hypothesis simply states that the parameter is not equal to a specified value.
This is typically written as:
- H1 : μ ≠ μ0
In a two-tailed test, the rejection regions are split between both tails of the sampling distribution. If the level of significance is α = 0.05, then 0.025 lies in each tail.
Example of Two-tailed Test Use
Suppose your company introduces a new pricing model and wants to know whether it affects average customer spending.
- H0 : μ = μ0
- H1 : μ ≠ μ0
You do not know whether spending will increase or decrease, and both outcomes are important. A two-tailed test allows you to detect any statistically significant change.
If the test statistic falls into either rejection region, or if the p-value is less than α, you reject the null hypothesis.
Why Two-Tailed Tests Are Common in Practice
In many business situations, there is genuine uncertainty about the direction of an effect. When testing new products, entering new markets, or changing customer-facing systems, the goal is often to understand whether behavior changes at all.
Two-tailed tests are also more conservative. Because the rejection regions are smaller in each tail, stronger evidence is required to reject the null hypothesis. This reduces the risk of incorrectly concluding that a change exists when it does not.
As a result, two-tailed tests are commonly used in exploratory analysis and in formal reporting, where stakeholders value caution and transparency.
Comparing One-Tailed and Two-Tailed Tests
While both tests use the same steps of hypothesis testing, they differ in key ways:
- Alternative hypothesis: One-tailed tests use > or <, while two-tailed tests use ≠.
- Rejection regions: One-tailed tests place all of α in one tail; two-tailed tests split it across two tails.
- Interpretation of p-values: In one-tailed tests, the p-value represents probability in one direction only. In two-tailed tests, it accounts for extreme values in both directions.
These differences affect how easily the null hypothesis can be rejected and how results should be interpreted.
Choosing the Right Test for Business Decisions
The choice between a one-tailed and two-tailed test should always be driven by the business question and the decision that follows.
If only one direction leads to action, and the opposite direction is not meaningful, a one-tailed test may be justified. If any departure from the current state matters, a two-tailed test is usually the better choice.
For example, when comparing two suppliers, you may care about any difference in delivery time, not just improvement. In this case, a two-tailed test better reflects operational risk.
In summary:
One-tailed and two-tailed hypothesis tests shape how statistical evidence is evaluated and how confident you can be in your conclusions. By understanding how direction, rejection regions, p-values, and levels of significance work together, you place yourself in a stronger position to make informed, data-driven business decisions.
As you continue learning business statistics, keeping your hypotheses aligned with your real-world objectives will ensure that your analyses remain both statistically sound and practically useful. See you in the next session, where we’ll talk about confidence intervals.

